 Prashanth Iyer
The Hockey Writers
86
Reads
0
Comments
What Are Detroit’s Best Puck Possession Line Combinations
What goes in to designing the perfect three-man forward line combination? You’ll often see fans and bloggers alike creating their own line combinations based on attributes such as speed, grit, and scoring prowess. While these physical attributes are important, what we ultimately care about is puck possession. What three-man forward unit is most effective at controlling the puck and producing scoring chances? Both last season and this season, I have tracked “puck possession” for each of the Detroit Red Wings line combinations by tracking shot attempts both for and against each three-man unit. Last season saw the “Kid Line” of Riley Sheahan, Tomas Tatar, and Tomas Jurco lead the way. What does this season look like?
Detroit’s Most Utilized Line Combinations
For this season, the Red Wings have had 232 different three-man forward groups on the ice for at least one shot attempt either for or against at 5v5. Of those 232 line combinations, 14 of them have been on the ice for at least 50 total 5v5 shot attempts, either for or against. These line combinations are listed below:
| Forward 1 | Forward 2 | Forward 3 | 5v5 Corsi For | 5v5 Corsi Against | 5v5 Corsi Events | 5v5 Corsi For% | Goals For | Goals Against | 5v5 GF% |
|---|---|---|---|---|---|---|---|---|---|
| Datsyuk | Tatar | Helm | 293 | 195 | 488 | 60.0 | 15 | 8 | 65.2 |
| Andersson | Glendening | Miller | 183 | 260 | 443 | 41.3 | 7 | 9 | 43.8 |
| Nyquist | Abdelkader | Zetterberg | 188 | 167 | 355 | 53.0 | 8 | 4 | 66.7 |
| Datsyuk | Abdelkader | Zetterberg | 196 | 116 | 312 | 62.8 | 11 | 5 | 68.8 |
| Nyquist | Franzen | Zetterberg | 108 | 118 | 226 | 47.8 | 5 | 6 | 45.5 |
| Nyquist | Sheahan | Tatar | 100 | 84 | 184 | 54.3 | 5 | 2 | 71.4 |
| Sheahan | Tatar | Jurco | 88 | 55 | 143 | 61.5 | 4 | 1 | 80.0 |
| Nyquist | Helm | Franzen | 58 | 50 | 108 | 53.7 | 2 | 5 | 28.6 |
| Sheahan | Glendening | Weiss | 35 | 58 | 93 | 37.6 | 3 | 2 | 60.0 |
| Nyquist | Jurco | Zetterberg | 49 | 38 | 87 | 56.3 | 1 | 1 | 50.0 |
| Glendening | Jurco | Miller | 39 | 42 | 81 | 48.1 | 5 | 1 | 83.3 |
| Sheahan | Tatar | Abdelkader | 51 | 30 | 81 | 63.0 | 5 | 1 | 83.3 |
| Abdelkader | Zetterberg | Pulkkinen | 30 | 25 | 55 | 54.5 | 0 | 0 | N/A |
| Sheahan | Tatar | Franzen | 32 | 21 | 53 | 60.4 | 0 | 1 | 0.0 |
*Data prior to 2/23/15 game vs. Anaheim
From this table, you can see that Detroit’s most utilized lines are pretty effective. Only four of the 14 line combinations have a Corsi For% less than 50%, indicating that these lines are controlling the puck when on the ice at 5v5. In fact, the Red Wings have more line combinations with a 5v5 CF% greater than 60% than they do line combinations with a CF% less than 50%.
I have a couple of interesting observations from this table:
1. Of the five line combinations that have >60% 5v5 CF%, either Pavel Datsyuk or Tomas Tatar is on the line combination. This season, of all forwards who have played at least 200 minutes at 5v5, Datsyuk and Tatar are in #1 and #2 respectively in 5v5 CF%. You can see how well they drive possession on multiple line combinations with different linemates.

Pavel Datsyuk’s line combinations have completely dominated the puck this season (Greg M. Cooper-USA TODAY Sports)
2. Of the four line combinations that have <50% 5v5 CF%, Luke Glendening is on three of them. This season, Glendening has been on 57 different line combinations, with eight of those line combinations being on the ice for >20 5v5 Corsi attempts. Only four of those eight line combinations have a 5v5 CF% >48.1%. I don’t want to bash Glendening because you’d be hard-pressed to find a guy that competes harder than him every night. However, it’s obvious that he simply does not drive puck possession when he’s on the ice.
3. The line combination of Nyquist-Franzen-Zetterberg has really struggled. These three guys individually can all score 30 goals in a season, but together they don’t dominate the puck. Granted, we don’t have the ability to evaluate quality of competition or zone starts here, but you can see that this line has been subpar when compared to the other combinations with these players.

Detroit Red Wings left wing Johan Franzen has not played well in a line combination with Gustav Nyquist and Henrik Zetterberg (Photo Credit: Andy Martin Jr)
4. Andersson-Glendening-Miller. They’ve been on the ice for 443 shot attempts at 5v5, but have a 5v5 CF% of just 41.3%. Imagine if that line was just slightly more effective, or if Babcock didn’t insist on using them so much? They somehow have managed to keep the goals against down to just nine, but nonetheless, this is a line that should not be seeing a significant amount of ice time.
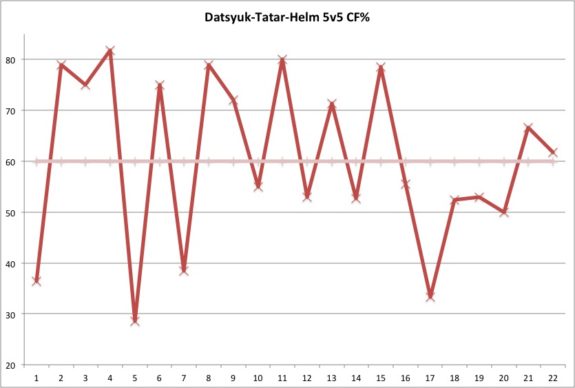
5. The Pavel Datsyuk-Tomas Tatar-Darren Helm line has been outstanding this season. They’ve played together in 29 games, and have been on the ice for >10 5v5 shot attempts in 22 of those games. Want to know how many times they’ve had a 5v5 CF% less than 50% in those 22 games? Four times. That’s right, in 18 of their 22 games together, they’ve won the puck possession battle. In fact, they’ve been above 60% in half of those games. Absolutely unreal. Below is a chart showing their 5v5 CF% by game in those 22 games with their season average graphed.
Why Does Line Combination Corsi For% Matter?
Some of you are probably wondering why this matters in the first place. We already have 5v5 Corsi For% data available for individuals and even for pairings via Hockey Analysis. However, line combination data really shows us how well each three-man unit is playing together. For example, using Hockey Analysis’ With Or Without You (WOWY) feature, we see that Stephen Weiss has played 146 minutes and 26 seconds at 5v5 with Riley Sheahan and the two of them together have a 5v5 CF% of 52.6%. Add a third player, linemate Luke Glendening, and the line combination Corsi For% becomes 37.6%, the lowest of any Red Wings’ line that has been on the ice for at least 12 shot attempts.

Detroit Red Wings right wing Luke Glendening has been a bit of a black hole on his line combinations (Photo Credit: Andy Martin Jr)
Another reason to utilize line combination CF% is in situations where a coach needs to juggle lines, due to injuries or a poor stretch of play. Right now, the Red Wings might be facing an extended period of time without their captain Henrik Zetterberg. Zetterberg has primarily played on a line with Justin Abdelkader and Gustav Nyquist, and the line combination has been successful with a 53.0% 5v5 CF%. How should Babcock adjust to Z’s absence? Having line combination data handy allows a coach to plug in a third player without sacrificing effectiveness.

Mike Babcock can use line combination Corsi For% to construct effective line combinations (Brace Hemmelgarn-USA TODAY Sports)
I can’t close out this article without addressing the limitations of what I’ve done. I don’t have any way of tracking time on ice to calculate per 60 minute rate statistics. I also don’t have a way to track quality of competition or zone starts so I can’t show which forward groups are doing better in tougher situations or vice versa. Finally, I’m looking at a very small sample size for most of these line combinations. It’s tough to make firm conclusions based on some of these numbers as some lines can be on the ice for as many as 40 shot attempts in a single game. I’m hoping to build a database of this over a few seasons to make firmer conclusions.
For the rest of the season, I will continue to track line combination data for the Red Wings and make my data available to anyone upon request.
Subscribe to our Red Wings stories to get email updates every time a new story is published.
Popular Articles


 Blackhawks Chicago
 Panthers Florida
 Penguins Pittsburgh
 Rangers New York
 Avalanche Colorado
 Kings Los Angeles
 Maple Leafs Toronto
 Bruins Boston
 Capitals Washington
 Flames Calgary
 Oilers Edmonton
 Golden Knights Vegas
 Islanders New York
 Sabres Buffalo
 Red Wings Detroit
 Flyers Philadelphia
 Senators Ottawa
 Lightning Tampa Bay
 Devils New Jersey
 Hurricanes Carolina
 Blue Jackets Columbus
 Predators Nashville
 Stars Dallas
 Jets Winnipeg
 Wild Minnesota
 Blues St. Louis
 Mammoth Utah
 Sharks San Jose
 Canucks Vancouver
 Ducks Anaheim


