Capitals 5 vs Sharks 4
Final Score
5
4
Scoring Summary
| 1st period | ||||
|---|---|---|---|---|
| 15:02 | WSH |

|
Jay Beagle (8) : Brooks Orpik (12) and Michael Latta (5) | |
| 2nd period | ||||
| 00:21 | SJS | PP |
|
Brent Burns (13) : Joe Thornton (35) and Logan Couture (29) |
| 00:43 | SJS |

|
Brent Burns (14) : Patrick Marleau (29) and Matt Nieto (10) | |
| 06:17 | WSH | PP |

|
Troy Brouwer (16) : Alex Ovechkin (19) and Nicklas Backstrom (40) |
| 14:48 | SJS |

|
Logan Couture (20) : Matt Nieto (11) and Patrick Marleau (30) | |
| 3rd period | ||||
| 11:17 | WSH |

|
Jay Beagle (9) : John Carlson (31) and Brooks Orpik (13) | |
| 13:26 | WSH |

|
John Carlson (7) : Marcus Johansson (19) and Nicklas Backstrom (41) | |
| 14:29 | SJS |

|
Joe Thornton (12) : Joe Pavelski (21) and Melker Karlsson (6) | |
| Overtime | ||||
| 02:42 | WSH |

|
Joel Ward (12) : Mike Green (28) and Jay Beagle (8) | |
Penalty Summary
| 1st period | ||||
|---|---|---|---|---|
| 12:06 | SJS |

|
Matt Irwin - Elbowing | |
| 13:11 | SJS |

|
MAJ | Brenden Dillon - Fighting |
| 13:11 | WSH |

|
MAJ | Troy Brouwer - Fighting |
| 19:00 | WSH |

|
Eric Fehr - Hooking | |
| 2nd period | ||||
| 05:05 | SJS |

|
Joe Pavelski - High-Sticking | |
Statistics Capitals Washington
Skaters
| # | Player | POS | G | A | PTS | +/- | PEN | PIM | S | BS | MS | GvA | TkA | Hits | FOW | FOL | PPTOI | SHTOI | Shifts | TOI | |
|---|---|---|---|---|---|---|---|---|---|---|---|---|---|---|---|---|---|---|---|---|---|
| 8 |  |
Alex Ovechkin | LW | 0 | 1 | 1 | -1 | 0 | 0 | 6 | 1 | 2 | 2 | 1 | 3 | - | - | 3.18 | 0 | 22 | 21.23 |
| 65 |  |
Andre Burakovsky | LW | 0 | 0 | 0 | 2 | 0 | 0 | 0 | 0 | 0 | 0 | 0 | 0 | - | - | 0.9 | 0 | 13 | 9.87 |
| 21 |  |
Brooks Laich | C | 0 | 0 | 0 | -1 | 0 | 0 | 2 | 4 | 1 | 0 | 3 | 0 | 1 | 0 | 0.02 | 0.97 | 24 | 17.6 |
| 44 |  |
Brooks Orpik | D | 0 | 2 | 2 | 2 | 0 | 0 | 2 | 2 | 1 | 1 | 0 | 6 | - | - | 0.02 | 0.73 | 31 | 23.3 |
| 16 |  |
Eric Fehr | C | 0 | 0 | 0 | -1 | 1 | 2 | 2 | 1 | 1 | 0 | 0 | 2 | 10 | 11 | 0.02 | 0 | 24 | 17.9 |
| 92 |  |
Evgeny Kuznetsov | C | 0 | 0 | 0 | 0 | 0 | 0 | 0 | 0 | 0 | 0 | 1 | 1 | 2 | 5 | 0.9 | 0 | 21 | 15.53 |
| 38 |  |
Jack Hillen | D | 0 | 0 | 0 | 0 | 0 | 0 | 0 | 1 | 0 | 1 | 0 | 0 | - | - | 0 | 0 | 18 | 12.95 |
| 25 |  |
Jason Chimera | LW | 0 | 0 | 0 | 0 | 0 | 0 | 1 | 0 | 0 | 2 | 0 | 0 | 1 | 0 | 0 | 0.38 | 20 | 13.92 |
| 83 |  |
Jay Beagle | C | 2 | 1 | 3 | 3 | 0 | 0 | 2 | 1 | 1 | 0 | 1 | 1 | 0 | 1 | 0.02 | 0 | 15 | 10.53 |
| 42 |  |
Joel Ward | RW | 1 | 0 | 1 | 0 | 0 | 0 | 4 | 0 | 0 | 0 | 2 | 1 | - | - | 0.9 | 0.38 | 27 | 17.98 |
| 74 |  |
John Carlson | D | 1 | 1 | 2 | 3 | 0 | 0 | 2 | 0 | 0 | 1 | 0 | 1 | - | - | 0.92 | 0.73 | 33 | 23.68 |
| 27 |  |
Karl Alzner | D | 0 | 0 | 0 | -2 | 0 | 0 | 2 | 2 | 0 | 0 | 0 | 3 | - | - | 0 | 0.62 | 28 | 21.2 |
| 90 | 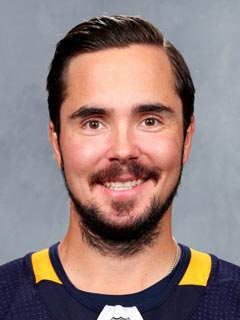 |
Marcus Johansson | LW | 0 | 1 | 1 | -1 | 0 | 0 | 3 | 0 | 2 | 1 | 0 | 3 | - | - | 2.28 | 0 | 21 | 18.37 |
| 2 |  |
Matt Niskanen | D | 0 | 0 | 0 | -2 | 0 | 0 | 1 | 0 | 1 | 3 | 0 | 1 | - | - | 0 | 0.62 | 28 | 20.98 |
| 46 |  |
Michael Latta | C | 0 | 1 | 1 | 2 | 0 | 0 | 1 | 1 | 1 | 1 | 0 | 4 | 1 | 3 | 0 | 0 | 10 | 8.72 |
| 52 |  |
Mike Green | D | 0 | 1 | 1 | 1 | 0 | 0 | 3 | 0 | 0 | 1 | 1 | 0 | - | - | 2.28 | 0 | 25 | 20.1 |
| 19 | 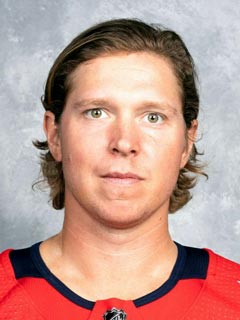 |
Nicklas Backstrom | C | 0 | 2 | 2 | -1 | 0 | 0 | 1 | 0 | 1 | 0 | 1 | 0 | 8 | 7 | 2.28 | 0 | 22 | 18.78 |
| 20 |  |
Troy Brouwer | RW | 1 | 0 | 1 | 0 | 1 | 5 | 1 | 0 | 1 | 0 | 0 | 6 | 0 | 3 | 2.28 | 0.97 | 23 | 17.15 |
| 70 | 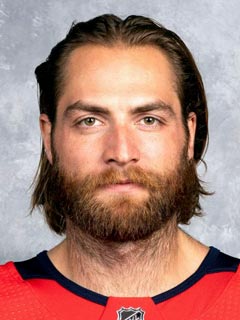 |
Braden Holtby | G | 0 | 0 | 0 | 0 | 0 | 0 | 0 | 0 | 0 | 0 | 0 | 0 | - | - | 0 | 0 | 0 | 0 |
| 35 |  |
Justin Peters | G | 0 | 0 | 0 | 0 | 0 | 0 | 0 | 0 | 0 | 0 | 0 | 0 | - | - | 0 | 0 | 0 | 0 |
Goalies
| # | Goalie | Lvl | 1st | 2nd | 3rd | OT | Saves-Shots | SV% | TOI | |
|---|---|---|---|---|---|---|---|---|---|---|
| 70 |  |
Braden Holtby (W) | 6 - 6 | 10 - 13 | 9 - 10 | 1 - 1 | 26 - 30 | 0.867 | 62.35 | |
| 35 |  |
Justin Peters | 0 - 0 | 0 - 0 | 0 - 0 | 0 - 0 | 0 - 0 | - | 0 |
Statistics Sharks San Jose
Skaters
| # | Player | POS | G | A | PTS | +/- | PEN | PIM | S | BS | MS | GvA | TkA | Hits | FOW | FOL | PPTOI | SHTOI | Shifts | TOI | |
|---|---|---|---|---|---|---|---|---|---|---|---|---|---|---|---|---|---|---|---|---|---|
| 89 |  |
Barclay Goodrow | C | 0 | 0 | 0 | 0 | 0 | 0 | 0 | 0 | 0 | 0 | 0 | 2 | - | - | 0 | 0 | 12 | 7.98 |
| 4 | 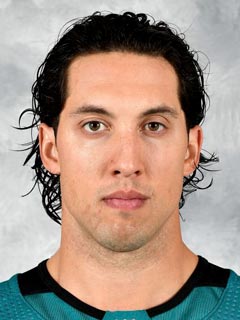 |
Brenden Dillon | D | 0 | 0 | 0 | 1 | 1 | 5 | 1 | 1 | 2 | 1 | 0 | 2 | - | - | 0 | 0.28 | 23 | 19.12 |
| 88 |  |
Brent Burns | D | 2 | 0 | 2 | 0 | 0 | 0 | 5 | 0 | 3 | 3 | 1 | 8 | - | - | 0.97 | 2.88 | 30 | 26.1 |
| 50 |  |
Chris Tierney | C | 0 | 0 | 0 | -1 | 0 | 0 | 0 | 1 | 0 | 0 | 0 | 1 | 4 | 6 | 0 | 0 | 14 | 8.52 |
| 15 |  |
James Sheppard | C | 0 | 0 | 0 | -1 | 0 | 0 | 2 | 1 | 1 | 2 | 2 | 2 | 4 | 3 | 0 | 0 | 17 | 12.87 |
| 8 | 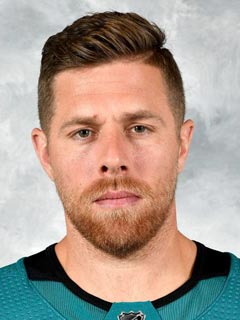 |
Joe Pavelski | C | 0 | 1 | 1 | -1 | 1 | 2 | 2 | 1 | 1 | 2 | 0 | 3 | 9 | 3 | 0.97 | 0.4 | 30 | 22.32 |
| 19 | 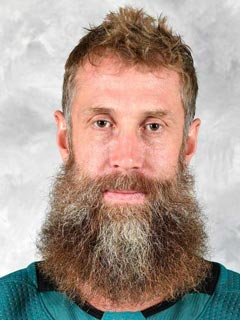 |
Joe Thornton | C | 1 | 1 | 2 | -1 | 0 | 0 | 1 | 1 | 0 | 2 | 1 | 2 | 5 | 4 | 0.97 | 0.8 | 31 | 21.53 |
| 20 |  |
John Scott | LW | 0 | 0 | 0 | 0 | 0 | 0 | 0 | 0 | 0 | 2 | 0 | 7 | - | - | 0 | 0 | 11 | 7.85 |
| 39 | 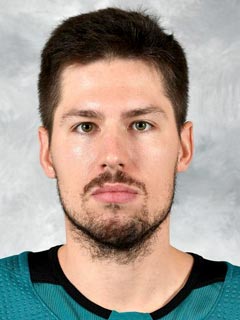 |
Logan Couture | C | 1 | 1 | 2 | 2 | 0 | 0 | 4 | 3 | 2 | 3 | 4 | 3 | 5 | 6 | 0.97 | 1.05 | 24 | 17.87 |
| 52 | 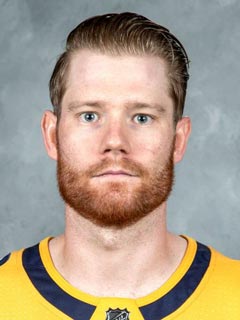 |
Matt Irwin | D | 0 | 0 | 0 | -1 | 1 | 2 | 1 | 1 | 0 | 1 | 0 | 1 | - | - | 0.38 | 0 | 24 | 19.18 |
| 83 | 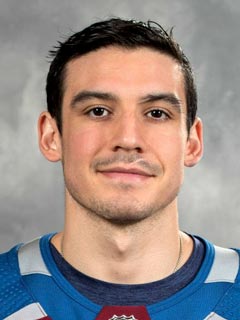 |
Matt Nieto | LW | 0 | 2 | 2 | 2 | 0 | 0 | 3 | 0 | 2 | 0 | 0 | 0 | - | - | 0.38 | 0.58 | 22 | 15.48 |
| 80 | 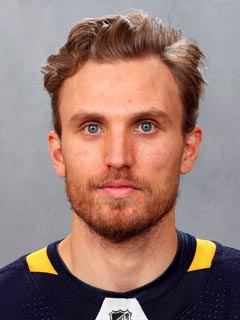 |
Matt Tennyson | D | 0 | 0 | 0 | -2 | 0 | 0 | 3 | 1 | 0 | 0 | 1 | 3 | - | - | 0.38 | 0.03 | 23 | 17.88 |
| 68 | 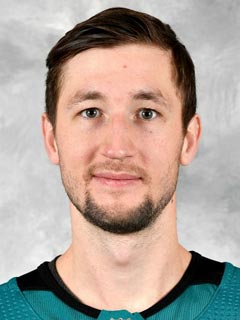 |
Melker Karlsson | C | 0 | 1 | 1 | 0 | 0 | 0 | 2 | 0 | 1 | 1 | 1 | 0 | - | - | 0 | 0 | 26 | 19.35 |
| 41 | 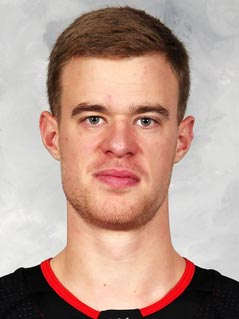 |
Mirco Mueller | D | 0 | 0 | 0 | 0 | 0 | 0 | 2 | 0 | 0 | 1 | 0 | 0 | - | - | 0 | 0.73 | 28 | 19.25 |
| 12 | 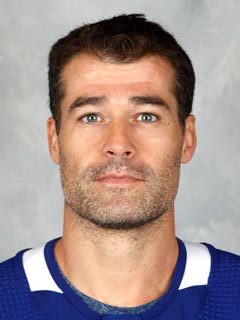 |
Patrick Marleau | C | 0 | 2 | 2 | 2 | 0 | 0 | 1 | 0 | 2 | 2 | 1 | 0 | 3 | 0 | 0.97 | 2.2 | 27 | 20.48 |
| 27 |  |
Scott Hannan | D | 0 | 0 | 0 | 0 | 0 | 0 | 1 | 1 | 1 | 0 | 0 | 3 | - | - | 0 | 2.47 | 30 | 23.02 |
| 48 | 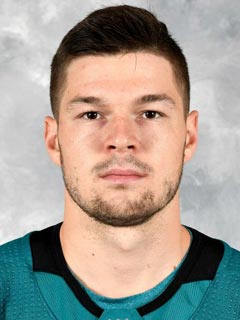 |
Tomas Hertl | C | 0 | 0 | 0 | -2 | 0 | 0 | 2 | 1 | 2 | 1 | 0 | 1 | 0 | 1 | 0.38 | 0 | 19 | 12.77 |
| 57 |  |
Tommy Wingels | C | 0 | 0 | 0 | -2 | 0 | 0 | 0 | 0 | 2 | 0 | 2 | 7 | - | - | 0.38 | 1.37 | 23 | 16.03 |
| 32 |  |
Alex Stalock | G | 0 | 0 | 0 | 0 | 0 | 0 | 0 | 0 | 0 | 0 | 0 | 0 | - | - | 0 | 0 | 0 | 0 |
| 31 | 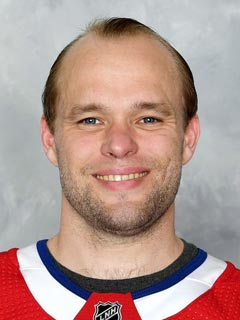 |
Antti Niemi | G | 0 | 0 | 0 | 0 | 0 | 0 | 0 | 0 | 0 | 0 | 0 | 0 | - | - | 0 | 0 | 0 | 0 |
Goalies
| # | Goalie | Lvl | 1st | 2nd | 3rd | OT | Saves-Shots | SV% | TOI | |
|---|---|---|---|---|---|---|---|---|---|---|
| 32 |  |
Alex Stalock | 0 - 0 | 0 - 0 | 0 - 0 | 0 - 0 | 0 - 0 | - | 0 | |
| 31 |  |
Antti Niemi (L) | 9 - 10 | 12 - 13 | 5 - 7 | 2 - 3 | 28 - 33 | 0.848 | 62.7 |
Score Line
| FINAL | 1st | 2nd | 3rd | OT | T |
|---|---|---|---|---|---|
| Capitals | 1 | 1 | 2 | 1 | 5 |
| Sharks | 0 | 3 | 1 | 0 | 4 |
Stars of the game
| WSH | Jay Beagle |
| SJS | Brent Burns |
| SJS | Melker Karlsson |
Team Stats
| Category | Capitals | Sharks |
|---|---|---|
| Power Plays | 1/2 | 1/1 |
| Hits | 32 | 45 |
| Faceoff Wins | 23 | 30 |
| Giveaways | 10 | 13 |
| Takeaways | 13 | 12 |
| Missed Shots | 12 | 19 |
| Blocked Shots | 13 | 21 |
| Penalty Minutes | 7 | 9 |
Shots
| Period | Capitals | Sharks |
|---|---|---|
| First | 10 | 6 |
| Second | 13 | 13 |
| Third | 7 | 10 |
| Overtime (1) | 3 | 1 |
| Total | 33 | 30 |











 Blackhawks Chicago
 Panthers Florida
 Penguins Pittsburgh
 Rangers New York
 Avalanche Colorado
 Kings Los Angeles
 Maple Leafs Toronto
 Bruins Boston
 Flames Calgary
 Oilers Edmonton
 Golden Knights Vegas
 Flyers Philadelphia
 Senators Ottawa
 Lightning Tampa Bay
 Red Wings Detroit
 Islanders New York
 Sabres Buffalo
 Devils New Jersey
 Hurricanes Carolina
 Stars Dallas
 Jets Winnipeg
 Blue Jackets Columbus
 Predators Nashville
 Wild Minnesota
 Blues St. Louis
 Mammoth Utah
 Ducks Anaheim
 Canucks Vancouver

