 Peter Denton
The Hockey Writers
41
Reads
0
Comments
Everything You Need to Know about Faceoffs, Home Ice, Goals, and the Predators
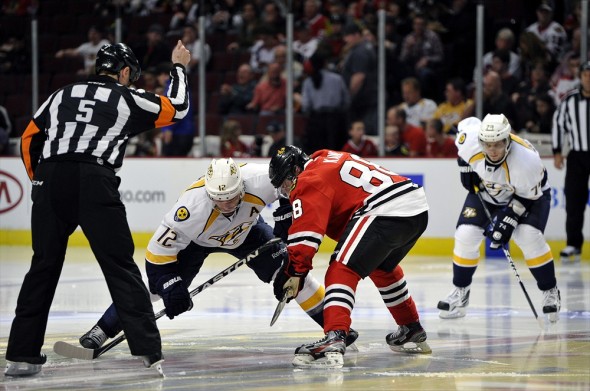
It is commonly accepted that faceoff victory correlates with puck possession. One study [pdf] shows that winning faceoffs leads to more goals, but does that correlation hold true for the Nashville Predators match up? There are several analyses floating around of faceoffs and goals, but I’d like to know how the Predators do, taking into account home ice advantage as well.
Predators’ Faceoff Leaders
Of the eight Predators with more than 100 faceoffs attempted, only three — Mike Fisher, Paul Gaustad, and Matt Cullen — have a win rate greater than 50%. Mike Ribeiro has taken the most faceoffs (1162) on the team, but won just 42.6% while Paul Gaustad’s impressive 57.0% ranks fifth in the league.
Faceoff, Goals, and Ice Statistics
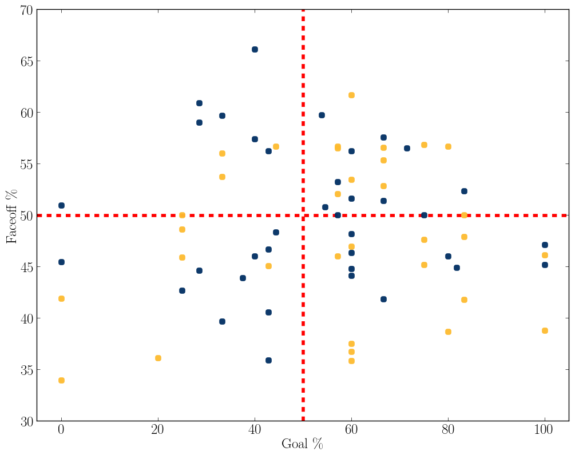
I compared three different numbers to see if, or when, beating opponents to the puck correlated with goals. Two of the numbers are faceoff percentage and goals percentage on a game by game basis. The final parameter is home ice. All three of these are drawn up below.
The blue dots are home games while the yellow are away. The right half is wins and the left losses. The top half is when the Predators beat their opponents on the draw most of the time while the bottom half is the opposite.
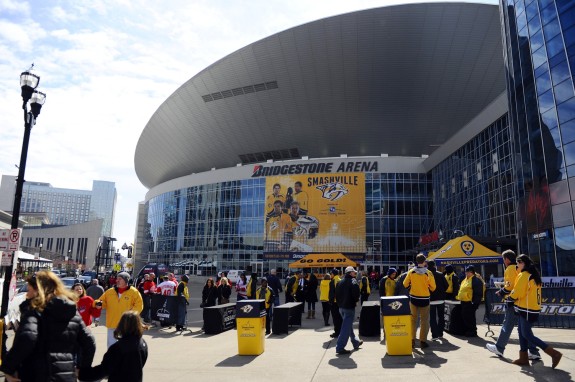
I calculated the correlation coefficient for each pair of these three numbers. We would expect each of them to be positive, both goal percentage and faceoff percentage should be higher at Bridgestone than elsewhere and games with a higher faceoff percentage should also have a higher goal percentage. For example, the correlation coefficient between goal percentage and home ice is 0.11 which has a statistical significance of 82%. Since the correlation coefficient is positive, we know that that the Predators have a higher goal percentage at home than on the road. The correlation between home ice advantage and faceoff percentage is a bit higher, 0.15 with a significance of 90%. And the money number is the correlation between faceoff percentage and goal percentage which comes in at 0.10 with a significance of 79%.
Squaring Off the Data
All three correlation coefficients are positive, as expected. The Bridgestone Arena advantage correlates with more faceoff wins and goals than being elsewhere and if the Predators are winning faceoff they are likely winning games.
The strongest correlation is between home ice and faceoff victory, while the weakest correlation is between getting the puck on the drop and getting the puck in the net.
The Predators are good at turning faceoff victories into victories on the scoreboard — and they are even better at it when in Nashville.
Popular Articles






































 Blackhawks Chicago
 Panthers Florida
 Penguins Pittsburgh
 Rangers New York
 Avalanche Colorado
 Kings Los Angeles
 Maple Leafs Toronto
 Bruins Boston
 Capitals Washington
 Flames Calgary
 Oilers Edmonton
 Golden Knights Vegas
 Flyers Philadelphia
 Senators Ottawa
 Lightning Tampa Bay
 Red Wings Detroit
 Islanders New York
 Sabres Buffalo
 Devils New Jersey
 Hurricanes Carolina
 Stars Dallas
 Jets Winnipeg
 Blue Jackets Columbus
 Predators Nashville
 Wild Minnesota
 Blues St. Louis
 Mammoth Utah
 Ducks Anaheim
 Sharks San Jose
 Canucks Vancouver


