Ducks 2 vs Sharks 4
Final Score
2
4
Scoring Summary
| 1st period | ||||
|---|---|---|---|---|
| 10:33 | ANA | PP |

|
Jakob Silfverberg (10) : Nick Ritchie (9) and Joshua Mahura (2) |
| 18:05 | SJS |
|
Melker Karlsson (4) : Joonas Donskoi (10) and Barclay Goodrow (2) | |
| 2nd period | ||||
| 05:44 | SJS |

|
Marcus Sorensen (7) : Joe Pavelski (8) and Joakim Ryan (5) | |
| 3rd period | ||||
| 03:53 | ANA |

|
Kiefer Sherwood (5) : Josh Manson (7) and Carter Rowney (6) | |
| 10:21 | SJS |

|
Brent Burns (5) : Brenden Dillon (9) and Barclay Goodrow (3) | |
| 19:37 | SJS | EN |

|
Tomas Hertl (13) : Barclay Goodrow (4) and Marc-Edouard Vlasic (9) |
Penalty Summary
| 1st period | ||||
|---|---|---|---|---|
| 04:23 | SJS |

|
Marc-Edouard Vlasic - Delaying Game-Puck over glass | |
| 05:59 | ANA |

|
Jakob Silfverberg - Tripping | |
| 09:30 | SJS |

|
Marcus Sorensen - Cross checking | |
| 2nd period | ||||
| 06:10 | ANA |

|
Jacob Larsson - Cross checking | |
| 09:03 | SJS |

|
Melker Karlsson - Slashing | |
| 16:10 | SJS |

|
Radim Simek - Roughing | |
| 16:10 | ANA |

|
Daniel Sprong - Roughing | |
| 18:23 | SJS |

|
Barclay Goodrow - Slashing | |
| 3rd period | ||||
| 10:21 | ANA |

|
Jakob Silfverberg - Unsportsmanlike conduct | |
Statistics Ducks Anaheim
Skaters
| # | Player | POS | G | A | PTS | +/- | PEN | PIM | S | BS | MS | GvA | TkA | Hits | FOW | FOL | PPTOI | SHTOI | Shifts | TOI | |
|---|---|---|---|---|---|---|---|---|---|---|---|---|---|---|---|---|---|---|---|---|---|
| 14 |  |
Adam Henrique | C | 0 | 0 | 0 | 0 | 0 | 0 | 0 | 2 | 0 | 0 | 2 | 0 | 3 | 3 | 3.62 | 2.13 | 22 | 17.08 |
| 7 |  |
Andrew Cogliano | C | 0 | 0 | 0 | 0 | 0 | 0 | 4 | 0 | 0 | 1 | 0 | 0 | 0 | 2 | 0 | 2.02 | 19 | 12.65 |
| 26 |  |
Brandon Montour | D | 0 | 0 | 0 | -2 | 0 | 0 | 2 | 1 | 3 | 1 | 4 | 0 | - | - | 3.97 | 3.12 | 28 | 26.23 |
| 23 |  |
Brian Gibbons | C | 0 | 0 | 0 | -2 | 0 | 0 | 1 | 1 | 0 | 0 | 1 | 0 | - | - | 0 | 0.6 | 13 | 8.2 |
| 24 |  |
Carter Rowney | RW | 0 | 1 | 1 | -1 | 0 | 0 | 2 | 0 | 1 | 0 | 0 | 1 | 5 | 2 | 0 | 2.77 | 17 | 11.95 |
| 11 | 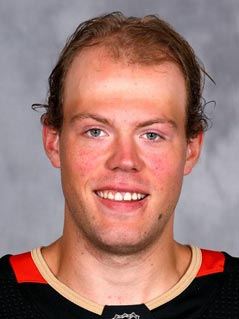 |
Daniel Sprong | RW | 0 | 0 | 0 | -2 | 1 | 2 | 3 | 2 | 0 | 1 | 0 | 2 | - | - | 3.3 | 0 | 21 | 17.28 |
| 47 | 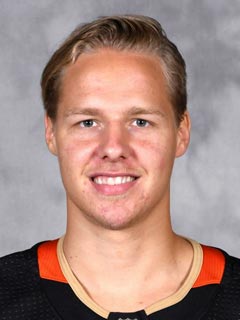 |
Hampus Lindholm | D | 0 | 0 | 0 | -1 | 0 | 0 | 2 | 1 | 1 | 1 | 0 | 0 | - | - | 0.9 | 3.07 | 31 | 23 |
| 32 |  |
Jacob Larsson | D | 0 | 0 | 0 | 1 | 1 | 2 | 1 | 0 | 1 | 0 | 0 | 0 | - | - | 0 | 1.28 | 23 | 18.85 |
| 21 | 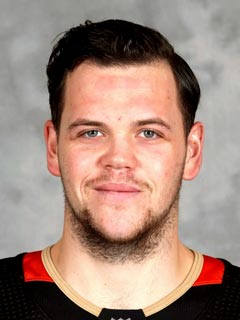 |
Jake Dotchin | D | 0 | 0 | 0 | -2 | 0 | 0 | 0 | 0 | 0 | 1 | 0 | 2 | - | - | 0 | 0.17 | 8 | 6.73 |
| 33 | 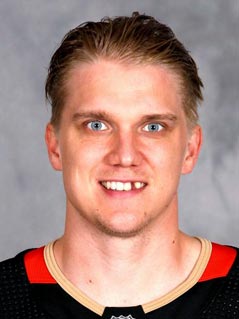 |
Jakob Silfverberg | RW | 1 | 0 | 1 | -2 | 2 | 4 | 3 | 1 | 0 | 2 | 0 | 0 | 2 | 0 | 3.62 | 0.62 | 21 | 14.12 |
| 42 | 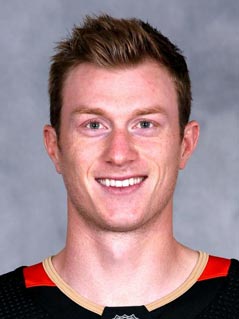 |
Josh Manson | D | 0 | 1 | 1 | 0 | 0 | 0 | 1 | 1 | 1 | 1 | 3 | 4 | - | - | 0 | 2.37 | 30 | 22.93 |
| 76 |  |
Joshua Mahura | D | 0 | 1 | 1 | -2 | 0 | 0 | 0 | 0 | 0 | 0 | 1 | 0 | - | - | 2.17 | 1.2 | 19 | 16.1 |
| 64 | 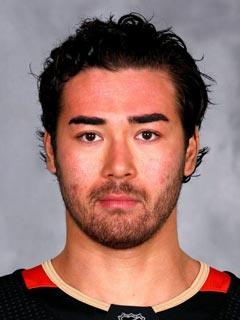 |
Kiefer Sherwood | LW | 1 | 0 | 1 | 0 | 0 | 0 | 2 | 0 | 0 | 0 | 0 | 0 | - | - | 0 | 0 | 14 | 10.03 |
| 37 | 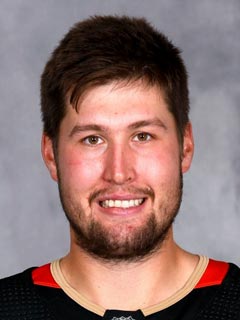 |
Nick Ritchie | LW | 0 | 1 | 1 | 0 | 0 | 0 | 1 | 0 | 1 | 0 | 1 | 0 | - | - | 3.43 | 0.48 | 18 | 14.07 |
| 25 | 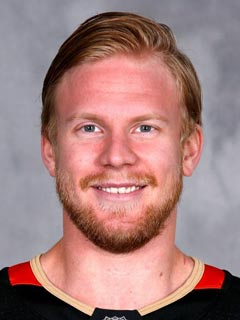 |
Ondrej Kase | RW | 0 | 0 | 0 | 0 | 0 | 0 | 1 | 1 | 1 | 1 | 0 | 1 | 1 | 0 | 2.65 | 0 | 20 | 15.98 |
| 20 |  |
Pontus Aberg | LW | 0 | 0 | 0 | -1 | 0 | 0 | 1 | 3 | 0 | 1 | 0 | 1 | - | - | 3.03 | 0 | 23 | 20.57 |
| 15 | 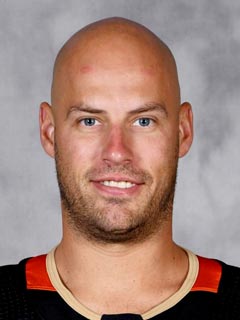 |
Ryan Getzlaf | C | 0 | 0 | 0 | -1 | 0 | 0 | 1 | 0 | 1 | 2 | 2 | 1 | 7 | 9 | 3.77 | 0.8 | 24 | 20.18 |
| 17 | 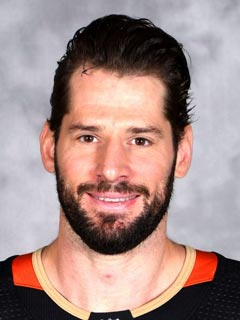 |
Ryan Kesler | C | 0 | 0 | 0 | -1 | 0 | 0 | 2 | 1 | 1 | 1 | 1 | 0 | 7 | 8 | 2.83 | 1.78 | 21 | 16.78 |
| 1 |  |
Chad Johnson | G | 0 | 0 | 0 | 0 | 0 | 0 | 0 | 0 | 0 | 2 | 0 | 0 | - | - | 0 | 0 | 0 | 0 |
| 36 |  |
John Gibson | G | 0 | 0 | 0 | 0 | 0 | 0 | 0 | 0 | 0 | 0 | 0 | 0 | - | - | 0 | 0 | 0 | 0 |
Goalies
| # | Goalie | Lvl | 1st | 2nd | 3rd | Saves-Shots | SV% | TOI | |
|---|---|---|---|---|---|---|---|---|---|
| 1 |  |
Chad Johnson (L) | 0 - 0 | 10 - 11 | 10 - 11 | 20 - 22 | 0.909 | 39.25 | |
| 36 |  |
John Gibson | 15 - 16 | 0 - 0 | 0 - 0 | 15 - 16 | 0.938 | 20 |
Statistics Sharks San Jose
Skaters
| # | Player | POS | G | A | PTS | +/- | PEN | PIM | S | BS | MS | GvA | TkA | Hits | FOW | FOL | PPTOI | SHTOI | Shifts | TOI | |
|---|---|---|---|---|---|---|---|---|---|---|---|---|---|---|---|---|---|---|---|---|---|
| 23 |  |
Barclay Goodrow | C | 0 | 3 | 3 | 3 | 1 | 2 | 0 | 1 | 0 | 0 | 1 | 2 | 1 | 3 | 0 | 1.65 | 19 | 11.52 |
| 4 | 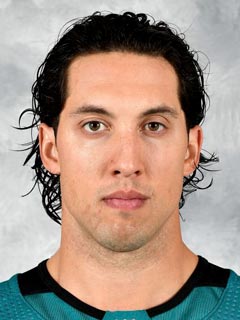 |
Brenden Dillon | D | 0 | 1 | 1 | 2 | 0 | 0 | 1 | 0 | 4 | 0 | 0 | 2 | - | - | 0.33 | 2 | 20 | 14.42 |
| 88 | 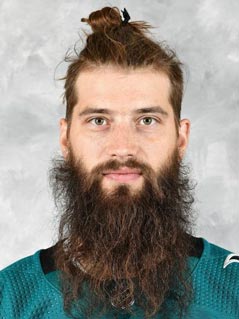 |
Brent Burns | D | 1 | 0 | 1 | 1 | 0 | 0 | 6 | 3 | 3 | 2 | 3 | 3 | - | - | 4.22 | 3.52 | 28 | 29.25 |
| 9 |  |
Evander Kane | LW | 0 | 0 | 0 | 0 | 0 | 0 | 3 | 1 | 0 | 1 | 1 | 1 | 0 | 3 | 3 | 0.72 | 21 | 18.4 |
| 47 |  |
Joakim Ryan | D | 0 | 1 | 1 | 1 | 0 | 0 | 1 | 0 | 2 | 0 | 0 | 1 | - | - | 0 | 0 | 8 | 6.08 |
| 8 |  |
Joe Pavelski | C | 0 | 1 | 1 | 1 | 0 | 0 | 3 | 0 | 0 | 0 | 0 | 1 | 4 | 4 | 2.6 | 0.03 | 23 | 17.67 |
| 19 |  |
Joe Thornton | C | 0 | 0 | 0 | 0 | 0 | 0 | 2 | 0 | 1 | 1 | 2 | 0 | 5 | 2 | 2.67 | 0 | 20 | 16.63 |
| 27 | 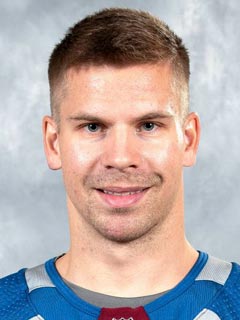 |
Joonas Donskoi | RW | 0 | 1 | 1 | 1 | 0 | 0 | 1 | 1 | 0 | 0 | 0 | 0 | - | - | 0.37 | 0 | 11 | 7 |
| 61 | 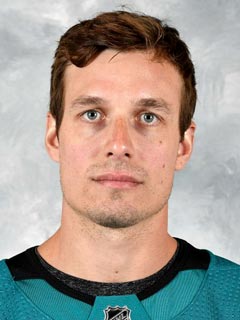 |
Justin Braun | D | 0 | 0 | 0 | 1 | 0 | 0 | 4 | 1 | 6 | 0 | 0 | 0 | - | - | 0 | 3.75 | 28 | 24.8 |
| 62 | 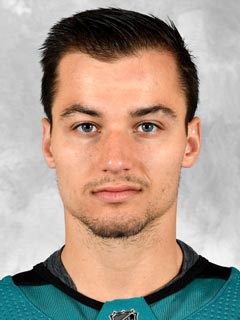 |
Kevin Labanc | RW | 0 | 0 | 0 | 1 | 0 | 0 | 1 | 1 | 0 | 0 | 0 | 0 | - | - | 3.32 | 0 | 14 | 12.63 |
| 39 | 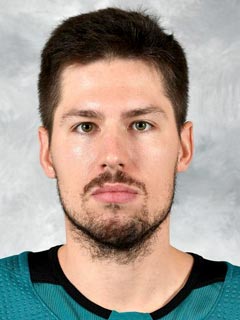 |
Logan Couture | C | 0 | 0 | 0 | 0 | 0 | 0 | 1 | 1 | 0 | 2 | 2 | 1 | 5 | 4 | 2.6 | 3.45 | 25 | 19.23 |
| 52 | 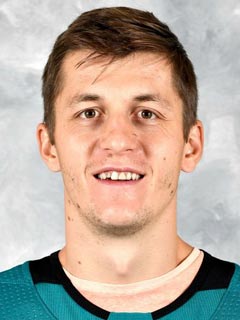 |
Lukas Radil | C | 0 | 0 | 0 | 0 | 0 | 0 | 1 | 0 | 0 | 1 | 0 | 0 | - | - | 0 | 0 | 11 | 8.47 |
| 44 | 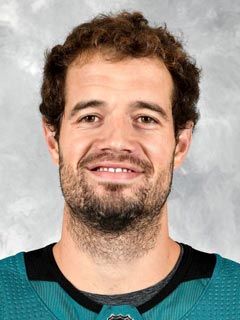 |
Marc-Edouard Vlasic | D | 0 | 1 | 1 | 1 | 1 | 2 | 1 | 1 | 1 | 0 | 4 | 0 | - | - | 2.28 | 3.18 | 30 | 24.93 |
| 20 | 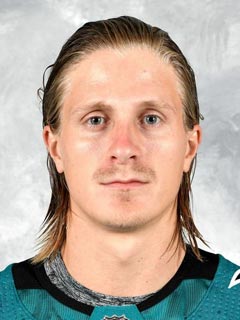 |
Marcus Sorensen | LW | 1 | 0 | 1 | 0 | 1 | 2 | 2 | 0 | 2 | 0 | 0 | 2 | - | - | 0 | 1.02 | 19 | 13.52 |
| 68 | 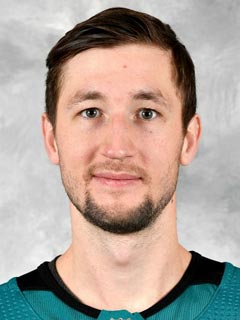 |
Melker Karlsson | C | 1 | 0 | 1 | 2 | 1 | 2 | 3 | 1 | 1 | 0 | 1 | 1 | - | - | 0 | 1.88 | 19 | 10.7 |
| 51 | 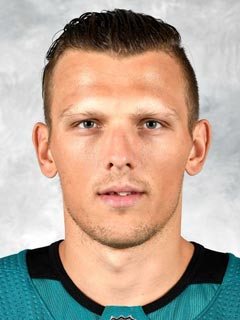 |
Radim Simek | D | 0 | 0 | 0 | 0 | 1 | 2 | 2 | 0 | 0 | 2 | 0 | 1 | - | - | 1.02 | 0.85 | 21 | 16.98 |
| 28 | 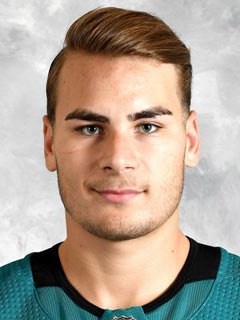 |
Timo Meier | RW | 0 | 0 | 0 | 0 | 0 | 0 | 3 | 1 | 2 | 0 | 0 | 0 | - | - | 3 | 0.73 | 20 | 17.48 |
| 48 | 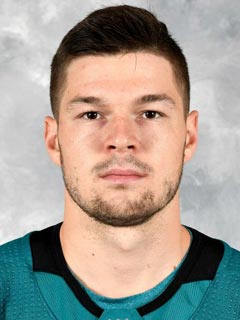 |
Tomas Hertl | C | 1 | 0 | 1 | 1 | 0 | 0 | 4 | 0 | 1 | 0 | 1 | 1 | 9 | 9 | 2.6 | 3.82 | 28 | 21.23 |
| 30 |  |
Aaron Dell | G | 0 | 0 | 0 | 0 | 0 | 0 | 0 | 0 | 0 | 0 | 0 | 0 | - | - | 0 | 0 | 0 | 0 |
| 31 | 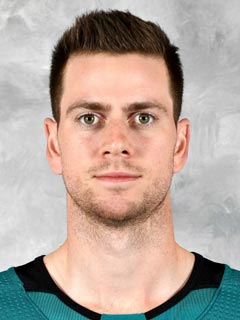 |
Martin Jones | G | 0 | 0 | 0 | 0 | 0 | 0 | 0 | 0 | 0 | 1 | 0 | 0 | - | - | 0 | 0 | 0 | 0 |
Goalies
| # | Goalie | Lvl | 1st | 2nd | 3rd | Saves-Shots | SV% | TOI | |
|---|---|---|---|---|---|---|---|---|---|
| 30 |  |
Aaron Dell | 0 - 0 | 0 - 0 | 0 - 0 | 0 - 0 | - | 0 | |
| 31 |  |
Martin Jones (W) | 11 - 12 | 8 - 8 | 6 - 7 | 25 - 27 | 0.926 | 60 |
Score Line
| FINAL | 1st | 2nd | 3rd | T |
|---|---|---|---|---|
| Ducks | 1 | 0 | 1 | 2 |
| Sharks | 1 | 1 | 2 | 4 |
Stars of the game
| SJS | Brent Burns |
| SJS | Melker Karlsson |
| SJS | Barclay Goodrow |
Team Stats
| Category | Ducks | Sharks |
|---|---|---|
| Power Plays | 1/4 | 0/3 |
| Hits | 12 | 16 |
| Faceoff Wins | 25 | 24 |
| Giveaways | 15 | 15 |
| Takeaways | 11 | 23 |
| Missed Shots | 14 | 12 |
| Blocked Shots | 15 | 10 |
| Penalty Minutes | 8 | 10 |
Shots
| Period | Ducks | Sharks |
|---|---|---|
| First | 12 | 16 |
| Second | 8 | 11 |
| Third | 7 | 12 |
| Total | 27 | 39 |





























 Blackhawks Chicago
 Panthers Florida
 Penguins Pittsburgh
 Rangers New York
 Avalanche Colorado
 Kings Los Angeles
 Maple Leafs Toronto
 Bruins Boston
 Capitals Washington
 Flames Calgary
 Oilers Edmonton
 Golden Knights Vegas
 Flyers Philadelphia
 Senators Ottawa
 Lightning Tampa Bay
 Red Wings Detroit
 Islanders New York
 Sabres Buffalo
 Devils New Jersey
 Hurricanes Carolina
 Stars Dallas
 Jets Winnipeg
 Blue Jackets Columbus
 Predators Nashville
 Wild Minnesota
 Blues St. Louis
 Mammoth Utah
 Canucks Vancouver

